What if you could see what’s coming next for your retail business? Predictive analytics makes that possible by using your historical data, smart algorithms, and machine learning to help forecast future trends and customer behaviors. Instead of just looking back at what’s happened, it gives you a glimpse of what could happen next, helping you make better, more informed decisions. With the power of AI, you can stay one step ahead, anticipate changes, and position your business for success in a constantly evolving market.
Why Business Leaders Can’t Afford to Ignore Predictive Analytics in Retail
As a leader in the retail space, you’re constantly juggling the need to stay ahead of the curve while managing day-to-day operations. But here’s the hard truth: relying on gut instinct or outdated methods to make decisions is no longer enough. The future of retail isn’t about reacting to trends—it’s about predicting them. And that’s exactly where predictive analytics comes in.
1. Stay on Top of Your Competition: Predictive analytics in retail helps you to locate trends before they become the next big thing. You can start influencing patterns early from data analysis, allowing your brand to be the first in line, while others play catching up.
2. Broaden The Horizons Of Your Decision-Making: Predictive analytics in retail provide real-time data actionable insights instead of relying on gut feelings. You get to make precise data-driven decisions, thus matching actual consumer behavior and market trends.
3. Streamlining Operational Efficiency: Accurately forecasting demand will optimize inventory and reduce stockout or overstock and waste. Predictive models, therefore, allow you to keep the right products at the right time with greater cost efficiency.
4. Improvement on Customer Experience: Retail predictive analytics personalize offers and recommendations by analyzing people buying behavior, or in other words, make the shopping experience greeting one more relevant to motivate value.
5. Elevate Profit Margins: Predictive analytics in retail is honing pricing strategy forecasting demand and customer behavior in spending. Such pricing strategies guarantee that products are priced competitively with the highest potential profit.
6. Reduce Risks: Predictive analytics in retail set forecasting from possible risks-to-consumer behavior changes to supply chain challenges-during which you can be on your toes and mitigate losses or respond fast to the challenges before they become a threat to your business.
7. Fueling Innovation: Retail predictive analytics reveal emerging trends so you can create innovations and develop new products or services that meet future customer needs while staying ahead in an ever-evolving market.
The KPIs That Every Retail Leader Should Track for Growth
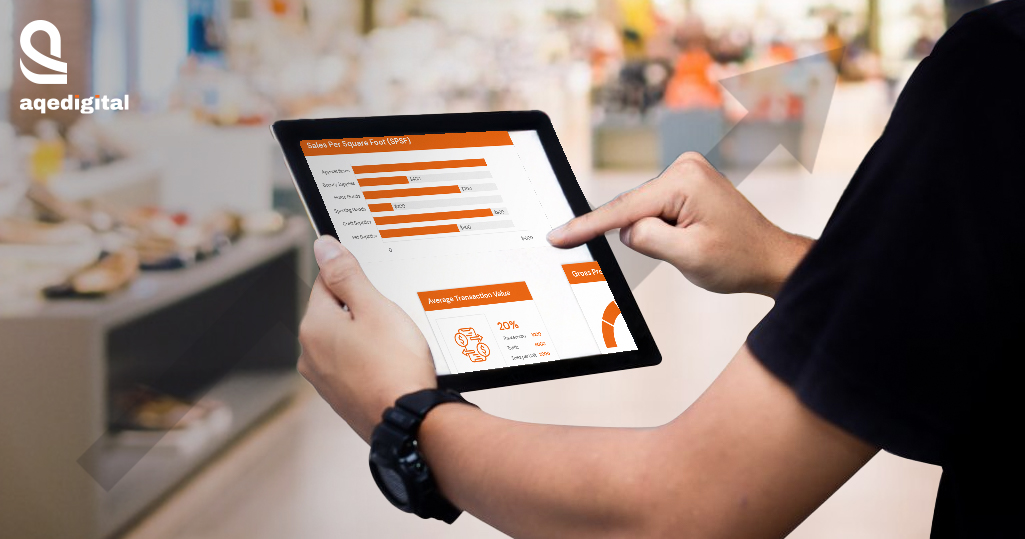
The KPIs That Every Retail Leader Should Track for Growth In the fast-paced world of retail, staying ahead of trends and making data-driven decisions is crucial to your business’s success. By leveraging a dedicated data analytics dashboard, retailers can tap into key performance indicators (KPIs) that not only predict trends but also help respond to them quickly and efficiently.
Below are the essential KPIs you should track to make the most of predictive analytics in retail:
![]()
1. Customer Lifetime Value (CLV)
- CLV is a predictive metric that estimates the total revenue a business can expect from a customer over their entire relationship with the brand. With this Key Performance Indicator, past data, frequency of purchases, and mean value of transactions can all be put together to provide a long-term profitability estimate for individual customers.
- Learning how to measure CLV means that a company today can be more selective in its best customers, more personalized in its marketing efforts, and better at retaining those customers. The most important thing, however, is that increasing CLV will eventually increase revenue without having to continually bring in new customers.
2. Sales Per Square Foot (SPSF)
- SPSF measures the sales generated per square foot of retail space. This metric is calculated as total sales divided by total square footage in your physical store. This gives an idea of the utilization of space and the overall performance of the store.
- By tracking KPI, a retailer is able to fine-tune their layout and product placement inside the store. A low SPSF indicates that the space is either underutilized or there are issues with space or inventory management. Thus, improving SPSF is maximally profitizing each retail square foot.
3. Inventory Turnover Rate
- This KPI measures how often inventory is sold and replaced over a set period. It’s calculated by dividing the cost of goods sold (COGS) by the average inventory for the period. An excessive turnover rate reflects efficient management of stock and great demand for the said products.
- High inventory turnover ensures one is not overstocking product unsold. Predictive analysis in retail helps attain the greatest balance of inventory levels by analyzing demand trends, thus minimizing the risks of stockouts or overstock situations, which in turn benefits cash flow.
4. Conversion Rate

- The conversion rate is the percentage of visitors who make a purchase out of the total number of visitors to your store (online or offline). This metric is calculated by dividing the number of transactions by the number of total visitors, then multiplying by 100.
- A high conversion rate indicates effective sales strategies and strong customer engagement. Using data analytics, retailers can identify the most effective touchpoints in the customer journey, optimize digital and in-store experiences, and increase the likelihood of turning visitors into paying customers.
5. Average Transaction Value (ATV)
- ATV measures the average amount spent per transaction. It’s calculated by dividing total sales by the number of transactions. This KPI gives insights into customer spending habits and how well you’re upselling or cross-selling.
- By tracking ATV, you can optimize pricing strategies, offer personalized recommendations, and create bundles to increase the value of each purchase. Predictive analytics in retail store can also forecast when customers are most likely to make high-value purchases, allowing for targeted promotions.
6. Customer Retention Rate
- The customer retention rate calculates the percentage of customers who return for repeat purchases over a specific period. This is derived by dividing the number of repeat customers by the number of total customers, then multiplying by 100. Retaining customers is significantly more cost-effective than acquiring new ones.
- A high retention rate means your brand is building loyalty and maintaining a strong customer base. By analyzing behavioral data, retailers can personalize experiences, predict churn, and take proactive measures to retain valuable customers.
7. Gross Profit Margin (GPM)
- GPM measures the difference between sales and the cost of goods sold, expressed as a percentage of sales. It’s calculated by subtracting COGS from total revenue, then dividing by total revenue and multiplying by 100. GPM helps you understand the profitability of your products.
- In case margins are lower, it can be assumed that there are some inefficiencies in pricing or sourcing or production costs. With the application of predictive analytics for retail stores, one can maximize pricing strategies and forecast future profitability in maintaining healthy margins.
8. Cart Abandonment Rate
- This KPI tracks the percentage of online shopping carts that are filled but not completed as purchases. It’s calculated by dividing the number of abandoned carts by the number of initiated transactions and multiplying by 100. A high cart abandonment rate signals issues in the checkout process or with customer experience.
- The checkout flow within retail is aided by predictive analytics, which assists in pattern identification or pinpointing problem areas that can be optimized by improving the user experience, monitoring spending habits for tailored incentives, or enhancing payment methods to stem abandonment.
9. Sales Growth Rate
- This metric measures the percentage increase or decrease in sales over a specific period. It’s calculated by comparing current sales to previous sales (month-over-month, year-over-year) and dividing the difference by the previous period’s sales, then multiplying by 100.
- Tracking sales growth helps you gauge the effectiveness of your marketing and sales strategies. Predictive analytics in retail identifies seasonal trends and customer behaviors, allowing you to forecast growth and adjust strategies to align with market demand.
10. Return on Investment (ROI)
- ROI calculates the profitability of an investment relative to its cost. It’s determined by dividing net profit by the total investment cost, then multiplying by 100. Tracking ROI ensures that your marketing, advertising, and business expansion efforts are generating the expected returns.
- With predictive analytics, retailers can more accurately project the success of various initiatives and optimize spending on the most profitable strategies.
The best part of harnessing data analytics –there’s no need for any changes. We simply use data analytics to look at the patterns in the data you already have. By understanding these patterns, we can uncover insights that help you make better decisions. Whether it’s spotting new opportunities for growth, improving efficiency, or enhancing customer experience, these insights are designed to help you move forward, all while keeping your current operations intact.
A Luxury Retailer’s Success Story – Enhancing Customer Retention with Targeted Marketing:
A luxury retailer focused on high-end fashion and accessories faced the challenge of boosting customer retention and driving repeat purchases without relying solely on traditional marketing tactics. In order to speak to those most important customers, they needed a more individual, personalised approach towards improving marketing efficiency. They had trouble segmenting and contacting their high-value customers, resulting in stagnant retention and poorly performing marketing programs. We helped them with an insight on customer behavior, predicting high-value purchases and preferences.
This allowed for personalized marketing campaigns that resonated with key buyers, resulting in 25% growth in repeat purchases and a 21% increase in customer retention.
How AQe Digital Empowers Retailers with Data-Driven Insights
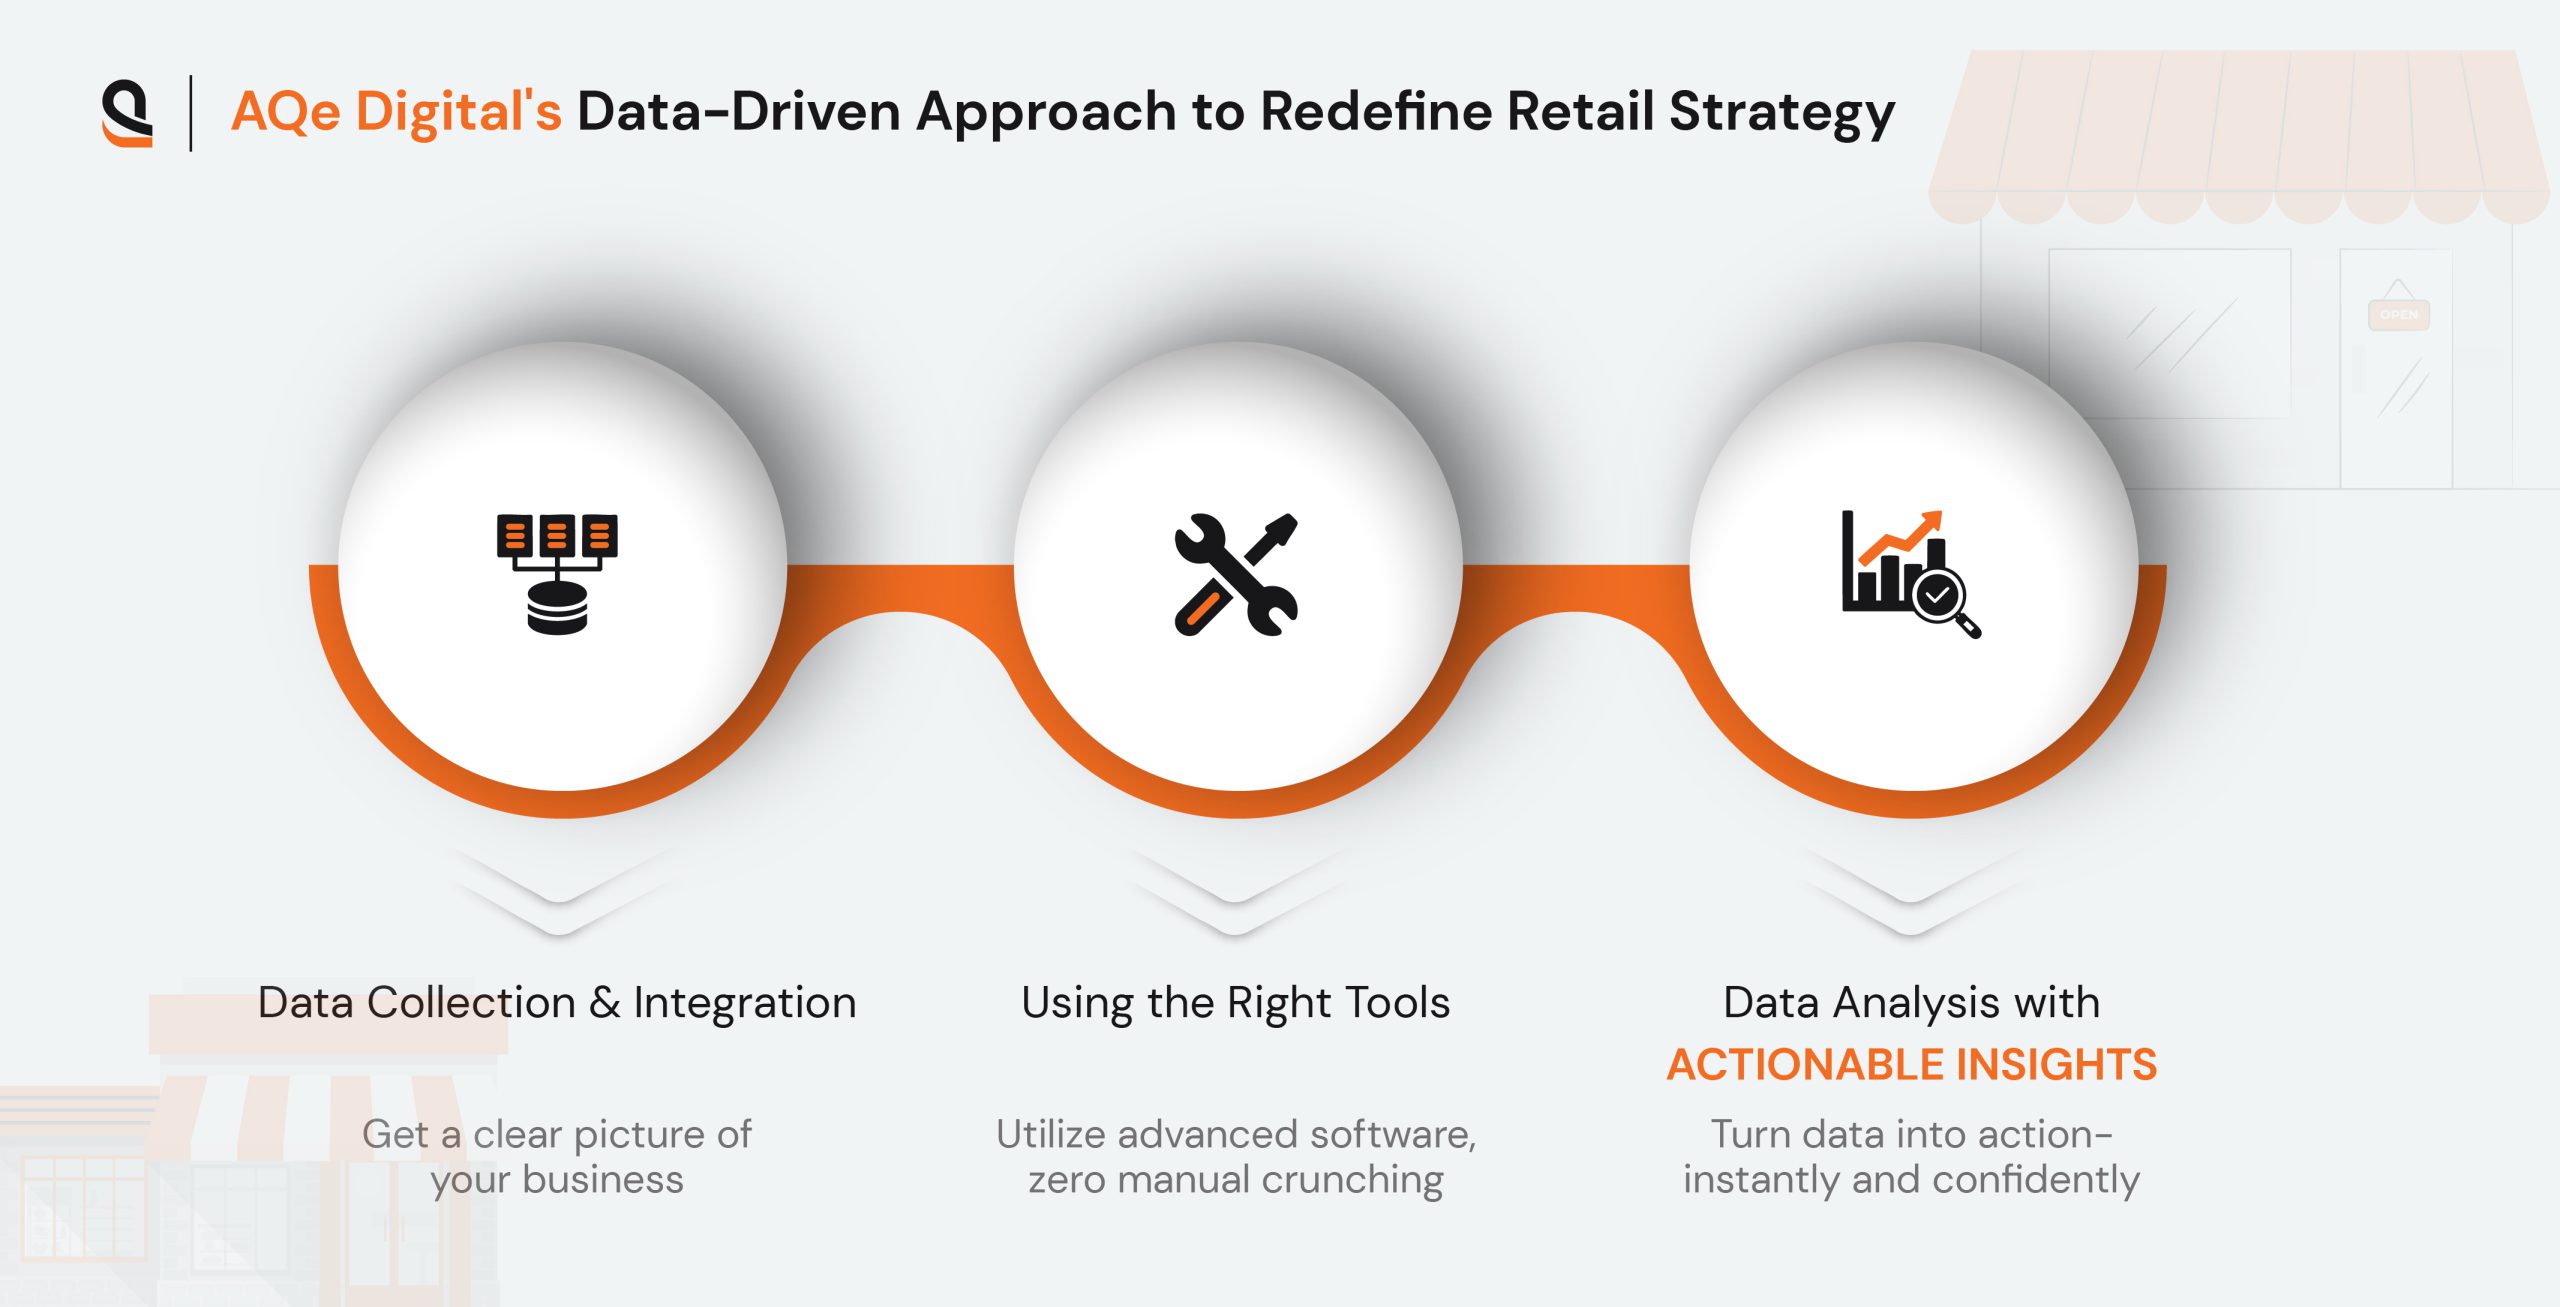
Step 1: Collecting and Integrating Data
The first step is scanning and integrating data; at AQe Digital, we make it the simplest of all to collect data from every channel that you operate: online, in-store, social media, or even mobile apps. Our seamless integration pulls everything into one central system, giving you clear visibility of business performance and customer behavior. No more guesswork or dispersed insights but just one unified, actionable picture.
Step 2: Apply the Right Tools
Not just any tools we equip you with the best customized software in the business. With Google Analytics, Power BI, and our own customizable cutting-edge predictive analytics software, we make complex data analysis a walk in the park. These little magical things work automatically, so you can stop wasting time on manual data crunching and move your focus to decisions that push your business forward.
Step 3: Analyzing and Acting on Insight
Waste no more time or effort scouring across data piles; it will let you catch trends and insights instantaneously with automated analytics from AQe Digital. No more sleepless hours digging out trends. Our system identifies patterns, highlights key opportunities, and delivers insights that empower you to make better, faster decisions. All you need to do is act—strategically and with confidence.
Ready to take the leap?
With AQe Digital, you’ll be making data-driven decisions like a pro, without the hassle. We’ve got the expertise, the tech, and the insights to push your retail business to the next level.